
Introduction
Welcome to the blog post of the Expert Services Marketing Practice.
We are happy to share our experience with you around Marketing Integration, Analytics, and Business Technology.
You want to see more? Click here

Background
With SAP Hybris Marketing Cloud, predictive models can be used for the calculation of predictive scores. Such predictive scores can be used, for example, in Segmentation to identify audiences for marketing campaigns.
With SAP Hybris Marketing Cloud 1708, you can bring in custom views and use these custom views to implement custom predictive scores in your quality tenant. In a nutshell, custom predictive scores can help you to answer business questions such as “Which customers tend to return the product they bought” or “Which customers tend to churn” by leveraging predictive analytics or machine learning capabilities.
Both business questions refer to a certain interaction/event (here: return or churn interaction), identically to the standard delivered Buying Propensity Score which refers to the sales order interaction. The target/dependent variable (e.g. churn) can be predicted by predictive algorithms (see Appendix) which usually take a lot of predictors/independent variables (e.g. demographic attributes, behavioral attributes, product attributes) into account to build up a predictive model which explains the relationships between the predictors and the target variable.
User story and business question
Our exemplary user story is about predicting churn for an insurance company, however as the general concept of churn applies to other industries as well (e.g. telecommunication or banking), the concept can be adapted to other industries quite easily.
The user story is the following: “As marketing expert, I want to identify all my existing car insurance policy customers, who have a high probability to cancel their policy. I want to transfer them into a target group and run a campaign with attractive offering with the intention to keep them as customers.” The first part of this user story can be answered by implementing a custom predictive score while the second part refers to standard SAP Hybris Marketing Cloud functionality.
The definition of the business question (here: “Which car insurance policy customers tend to churn”) by the marketing experts or business users should always be the first step before the actual implementation of the predictive score starts.
Implementation
After the business question has been defined, the training data set columns (the predictors and the target variable) for the predictive model can be built. The training data set is basically a custom modeled HANA calculation view on top of several other views and tables in the HANA database.
Before the HANA view modelling can start, the data sources which shall be the basis for both the target variable and the predictors need to be identified. One obvious prerequisite is that the data is already loaded into and available in the HANA database on which SAP Hybris Marketing Cloud runs. Apart from that, the data quality (completeness, accuracy etc.) has to be checked to get good results. Ensuring good data quality is always important, but in the area of predictive analytics or machine learning it gets crucial. The best algorithms can’t return good prediction results on bad data or compensate for bad data quality!
In our insurance example, the underlying data model has been modeled with the help of Hybris Marketing Cloud standard entities and Custom Business Objects (CBOs). For an in-depth introduction into CBOs, please refer to the following blogs of my colleagues (https://blogs.sap.com/2016/10/11/extensibility-interaction-contact/ and https://blogs.sap.com/2017/05/12/usage-of-odata-service-of-custom-business-object/) or the standard documentation.
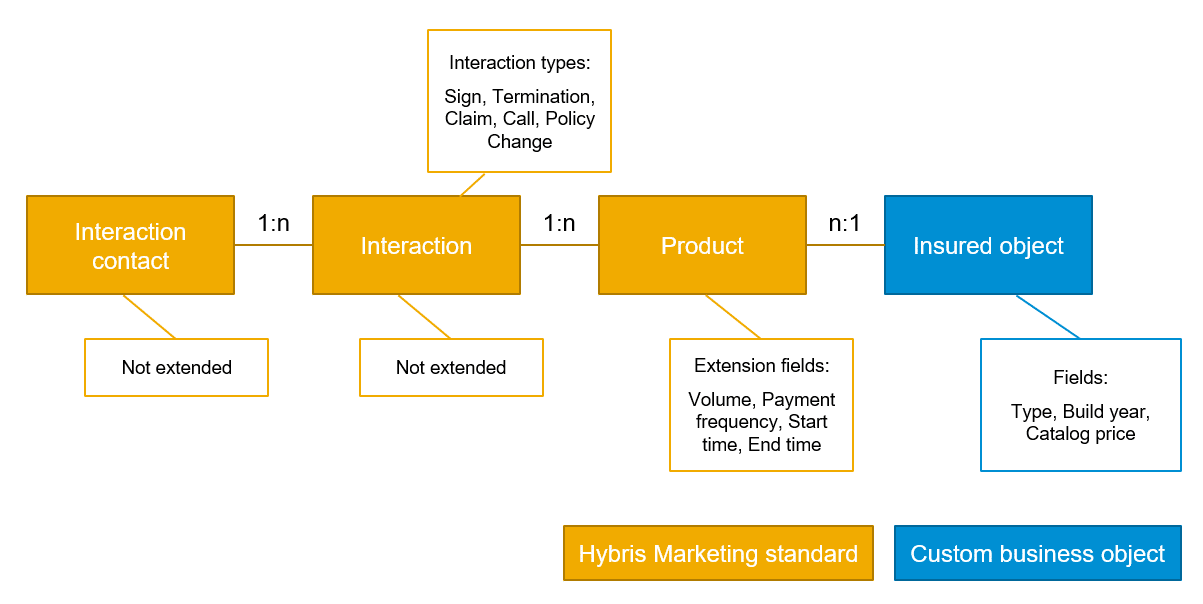
In more detail, the data model has been modeled as follows:
- The actual insurance policy holders are modeled as interaction contacts (SAP Hybris Marketing Cloud standard, not extended).
- All transactional data (e.g. new policy signings, claims, calls, policy terminations) are modeled as interactions (SAP Hybris Marketing Cloud standard, not extended).
- The insurance policies are modeled as products (SAP Hybris Marketing Cloud standard, extended by four fields).
- The insured objects are modeled as Custom Business Objects.
Creating a Data Source View
The data source view, a HANA calculation view, is responsible for building the actual flat data structure based on the defined business question and the underlying data model. Almost all predictive algorithms which have been developed only work on flat data, meaning each historical observation and non-classified observations are contained on one row. The original relational data structure has to be denormalized / flattened.
In our example, a simplified output of the insurance data source view looks like this (The full list of predictors can be found in the Appendix):
|
[…] |
Country |
Age |
Days since last policy sign |
No. of claims |
No. of insured vehicles |
Avg. catalog price of insured vehicles |
[…] |
Churn (Target variable) |
|
DE |
27 |
300 |
2 |
1 |
10.000 |
1 (yes) |
||
|
US |
? |
50 |
0 |
3 |
50.000 |
0 (no) |
||
|
CA |
35 |
600 |
1 |
1 |
30.000 |
0 (no) |
Some of the attributes are simple demographic attributes such as country and age which can be selected or easily calculated from the interaction contact data. However some of the fields have to be flattened through aggregation and calculated through more complex logic (e.g. the current number of insured vehicles or the average catalog price of all the insured vehicles specific to a policy holder).
The same is true for the target variable itself. In this exemplary case, the HANA view has been modeled in a way that it includes an input parameter for a specific car insurance policy type (e.g. Comprehensive Cover Policy or Full Glass Policy). The churn event is then being calculated for this specific policy type. This has the advantage that we can calculate the churn score not only for any policy, but to specific policy types separately.
The target variable has to be an integer which describes the 0/1-classification of the row (here: per customer). Multiple target variables are also supported from the framework, if you plan to create one predictive model for each of the target variables.
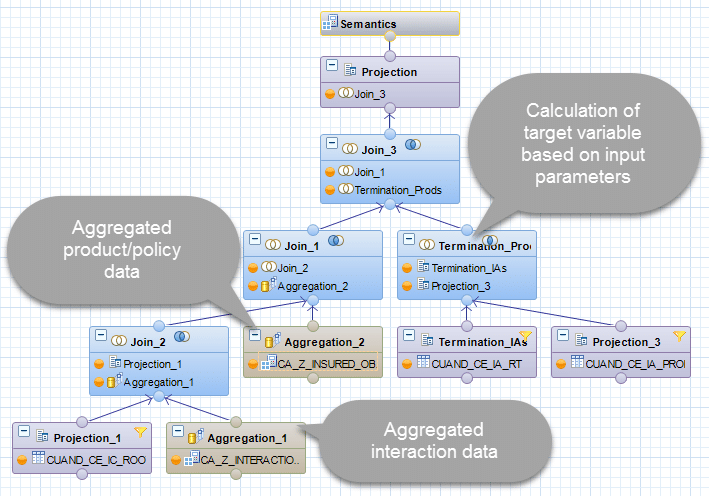
As outlined above, in our example, the calculation of the target variable is dependent on an input parameter. More specifically, the IP_TARGETPRODUCT (car insurance policy) defines for which policy type the churn shall be calculated. The IP_TARGETPRODUCT parameter is one of four mandatory input parameters for a data source view. The others are IP_DOC_DATE_START, IP_DOC_DATE_END and IP_JOIN_SET_ID. The first two ones should modify the date range to be taken into account from the view. This means that these input parameters should be pushed down, so that e.g. only interactions such as churns from that specified date range are taken into account. The concept behind the IP_JOIN_SET_ID is described in the appendix.
In some cases, one calculation view might not be sufficient or existing reference views should be re-used within the data source view. In that case, these reference views are included in the data source view. In context of this example, multiple reference views and one value help view (for the policy type) were included in the data source view.
Importing the Data Source View
After the data source view (and possibly further reference views) have been designed, they need to be imported into your SAP Hybris Marketing Cloud system.
The process of exporting the HANA view from HANA studio is described in the following blog: https://blogs.sap.com/2016/07/18/build-and-import-sap-hana-views-for-segmentation-in-s4hana-marketing-cloud-1605/
For our scenario, only the very last step (using the Add Custom View App) is different from the blog above. You should start with importing your reference views first using the “Unassigned” View Usage Type. After uploading the reference views, the reference views are stored under saphana-appcuancustom_segucv (the view path is also contained in the success message after importing the custom view). Same is true for any value help views, which should be uploaded using the “Value Help” View Usage Type and stored under saphana-appcuancustom_seguvi.
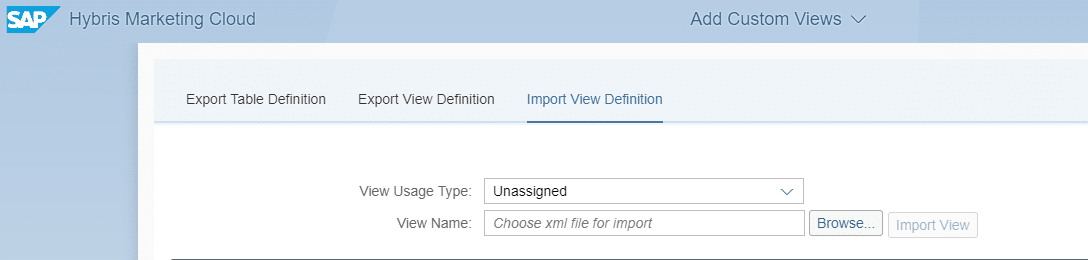
Make sure to update the references in your main data source view to the view paths above if you are using reference views and/or value help views. After all reference and value help views have been uploaded and the views are correctly referenced, the data source view using the View Usage type “Predictive Data Source” can be uploaded. Data source views get stored under saphana-appcuancpredcusprds.

You can now use your uploaded view in Predictive Scenarios.
Creating Predictive Scenarios
After the data source view has been successfully loaded into the system, the predictive scenario can be created on top of the view in your quality tenant. The predictive scenario defines which data source view is used, which attributes are the target variables and which attributes should be taken as predictors, the independent/explaining variables.
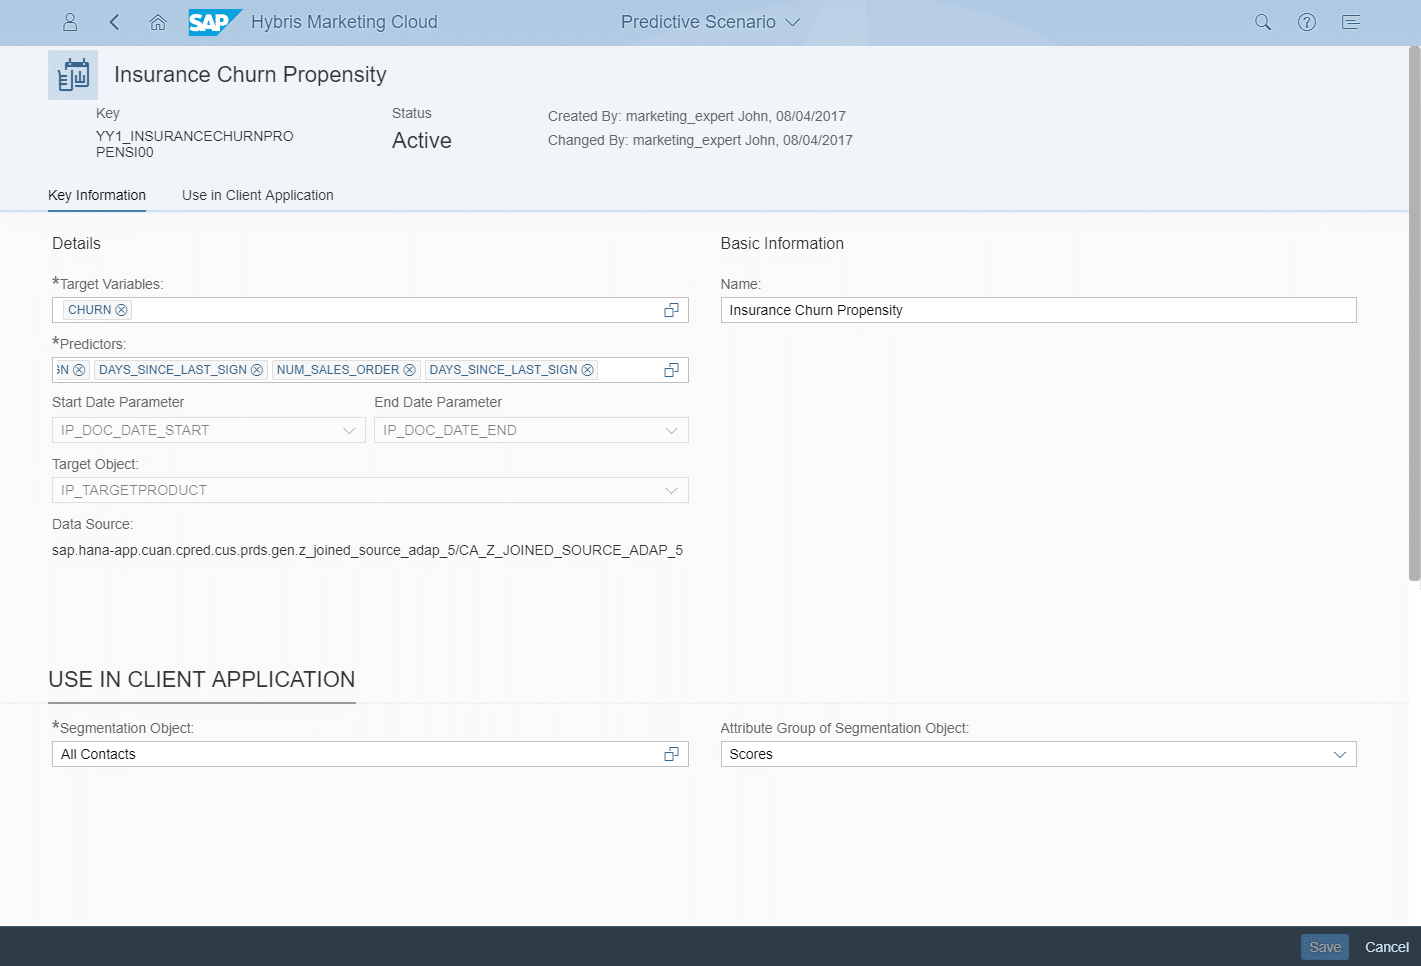
Additionally, the segmentation object for which the predictive scenario should be used can be selected together with the attribute group in which you want to see the calculated score on the UI later.
Consuming Predictive Scores
After the custom predictive scenario is configured and activated in your quality tenant, it can be used within the predictive studio for creating new predictive models and publishing them as predictive scores. The screenshot below shows the configured predictive model, using the predictive scenario “Insurance Churn Propensity” (1). For this exemplary score, the target object “Comprehensive Cover” policy has been chosen (2) and the analysis period has been set to 2007 – 2017 (3). These settings set the input variables IP_TARGETPRODUCT, IP_DOC_DATE_START and IP_DOC_DATE_END.
For training the model and creating a model fit, a training set has to be chosen (4). A training set is simply a Hybris Marketing target group which has to have observations of both 0/1-classifications (in our example churners and non-churners). After the target variable (5) is set, you can create a new model fit and start the model training.

The results of such a model fit are shown below.

In addition to the most contributing predictors, which allows you to examine the relative significance of the variables within the model, the framework displays both the calculated predictive power and the prediction confidence of the created model fit. An explanation of both KPIs can be found in the Appendix.
You can now select the highest-scoring members using our score within the Segmentation. Within our example (based on artificial data), by selecting the 9% of the top-ranked customers for this specific score, we can get >90% of the churners. Returning to the user story from above, marketing experts can now identify all existing car insurance policy customers, who have a high probability to cancel their policy.
Appendix: Full list of (exemplary) predictors
All following predictors are calculated per policy holder/customer individually.
|
Predictor |
Source(s) |
|
Age |
Customer master data |
|
Country |
Customer master data |
|
Date of birth |
Customer master data |
|
Marital status |
Customer master data |
|
Region |
Customer master data |
|
Sex |
Customer master data |
|
Remaining days of selected policy (input parameter) |
Product/policy data and input parameter |
|
Total policy volume |
Product/policy data |
|
Average selected payment frequency of policies |
Product/policy data |
|
Average remaining days of all current policies |
Product/policy data |
|
Days since last call |
Interaction data |
|
Days since last claim |
Interaction data |
|
Days since last policy change |
Interaction data |
|
Days since last policy sign |
Interaction data |
|
Days since last policy termination |
Interaction data |
|
Total number of calls |
Interaction data |
|
Total number of claims |
Interaction data |
|
Total number of policy changes |
Interaction data |
|
Total number of policy signs |
Interaction data |
|
Total number of terminations |
Interaction data |
|
Total number of insured objects |
Product/policy data and insured object data |
|
Total number of insured sport cars |
Product/policy data and insured object data |
|
Total number of insured family cars |
Product/policy data and insured object data |
|
Total number of insured SUVs |
Product/policy data and insured object data |
|
Average build year of all insured objects |
Product/policy data and insured object data |
|
Average catalog price of all insured objects |
Product/policy data and insured object data |
|
Total catalog price of all insured objects |
Product/policy data and insured object data |
Appendix: Algorithms
For calculating predictive scores, SAP Hybris Marketing Cloud uses algorithms from the Automated Predictive Library (APL). The APL is a implementation of automated predictive capabilities running directly in SAP HANA. In contrast to the SAP Predictive Analytics Library (SAP PAL), which is also a HANA-native implementation library of predictive algorithms, the APL is suited rather for on-the-fly predictive scoring capabilities without needing to explicitly model the analytical workflow.
Andreas has written a really nice blog about how automated analytics does “the magic” behind creating predictive models automatically: https://blogs.sap.com/2015/07/01/how-does-automated-analytics-do-it-the-magic-behind-creating-predictive-models-automatically/. I highly recommend that you go through this blog to understand what’s behind automated algorithms.
In addition, there are some tutorial videos on APL on the SAP HANA Academy youtube channel which describe how APL work. The video below describes how claim frauds can be predicted using APL. The full playlist of all videos related to APL can be found here: Playlist: Automated Predictive Library
Appendix: Predictive measures
The predictive power and the prediction confidence are calculated as follows:
- Of the estimation dataset (default plot), the predictive power corresponds to “the area found between the curve of the model generated and that of the random model” divided by “the area found between the curve of the perfect model and that of the random model”. As the curve of the generated model approaches the curve of the perfect model, the value of the predictive power approaches 1.
- Of the estimation, validation and test datasets (select the corresponding option from the list Dataset, located below the plot), the prediction confidence corresponds to one minus “the area found between the curve of the estimation dataset and that of the validation dataset “divided by “the area found between the curve of the perfect model and that of the random model”.
The following graph displays the predictive power and the prediction confidence:

Appendix: Join Set ID
The concept of the Join Set ID is described quite nicely in the product documentation where this except below is taken from.
Predictive Analytics is typically based on high amounts of data. In contrast to a classic relational data access, the data is processed on large parts of an even larger complete data set. To minimize runtime and/or memory overhead, the data should be strictly limited to the amount that is needed for the current predictive analysis.
For this purpose, the concept of the Join Set ID has been introduced. The Join Set ID represents only the contact keys that are relevant for a predictive model. With this ID, instead of creating database joins with the complete base of contact keys, joins are created using only the relevant contact keys. Usually, these relevant contact keys make up a smaller data set. Consequently, the amount of data processed is reduced.
We strongly recommend, that you push the Join Set down to the lowest level in order to reduce the processed data, as early as possible.
This means, that you join the join set table with the base table as shown in the screenshot:

Summary
With this blog, you have seen what is behind custom predictive scores and how they can be implemented in SAP Hybris Marketing Cloud. You should now be able to implement your own score which can help you to answer some of your business questions with the help of predictive analytics or machine learning.
You want to see more? Check out our blogs by searching for the tags assigned to this blog.
Your SAP Hybris Expert Services – Marketing Practice team.
New NetWeaver Information at SAP.com
Very Helpfull