
Visualize your Raspberry Pi sensor data with the Smart Business Service: In this blog, I describe how easy it is to visualise my Raspberry Pi sensor data leveraging the Smart Business Service.
As a precondition, in these two previous blogs, I made my Raspberry Pi sensor data available as a OData4SAP annotated OData service: Measure your Raspberry Pi sensor data on the go with the Smart Business Service and discoverable by the Smart Business Service: Enable Smart Business to Discover HANA Analytic OData Services by HANA views.
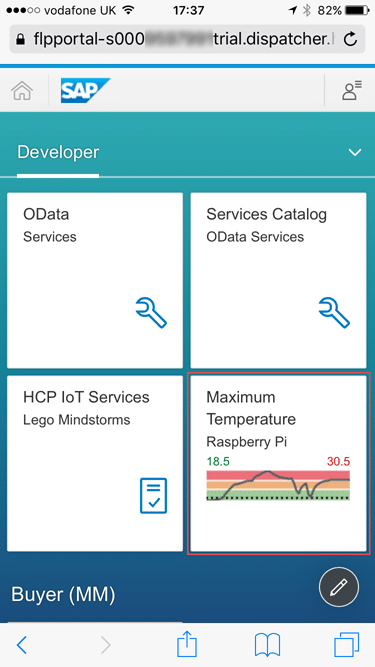
Of course with these OData4SAP annotations, it is easier than ever to consume my OData service in a Fiori Overview Page as per my previous blog: Display your Lego Mindstorms sensor data on a Fiori Overview Page and deploy it to the HCP Portal Fiori Launchpad, but with the Smart Business Service I get this visualization out of the box:

The only thing I must do to achieve this is choosing the Trend tile and configure the correct Dimension:

However, to have a moving 1 hour window into my data, I also limit this dimension to the last hour:

And that is it really. In my opinion, for this type of data, the most efficient way to get a nice RAG visualization, that renders on any device and is easily accessible on my phone since hosted in the SAP Cloud Platform:
New NetWeaver Information at SAP.com
Very Helpfull